
Visualization of molecules at surfaces
This is a short post about how to visualize molecules at surfaces.This is one of my pet peeves about scientific illustrations: they are often not very clear. I have seen many illustrations of molecules at surfaces that are close to useless. I think this is a shame, because it is not very difficult to make them look nice. I will show you how to do it in this post.
The problem
Here is a comparison of what I mean:
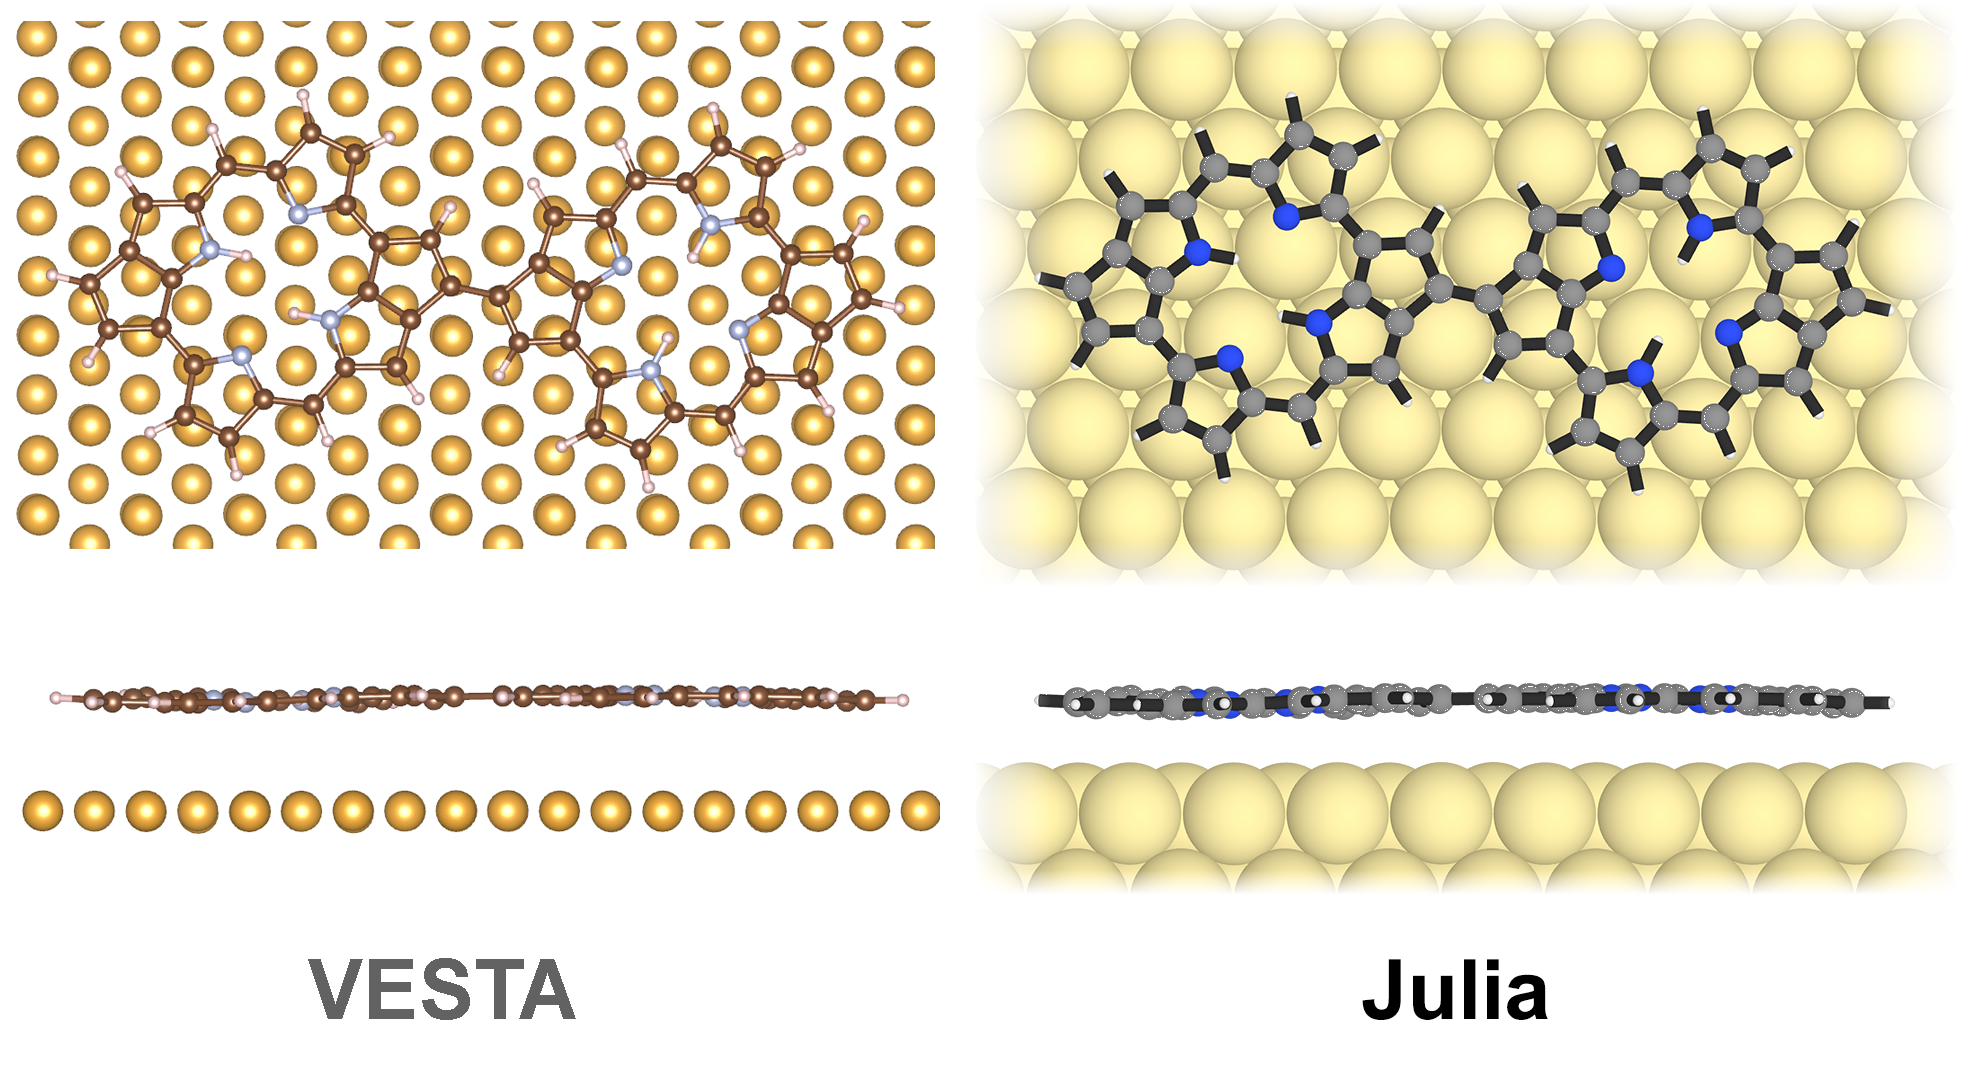
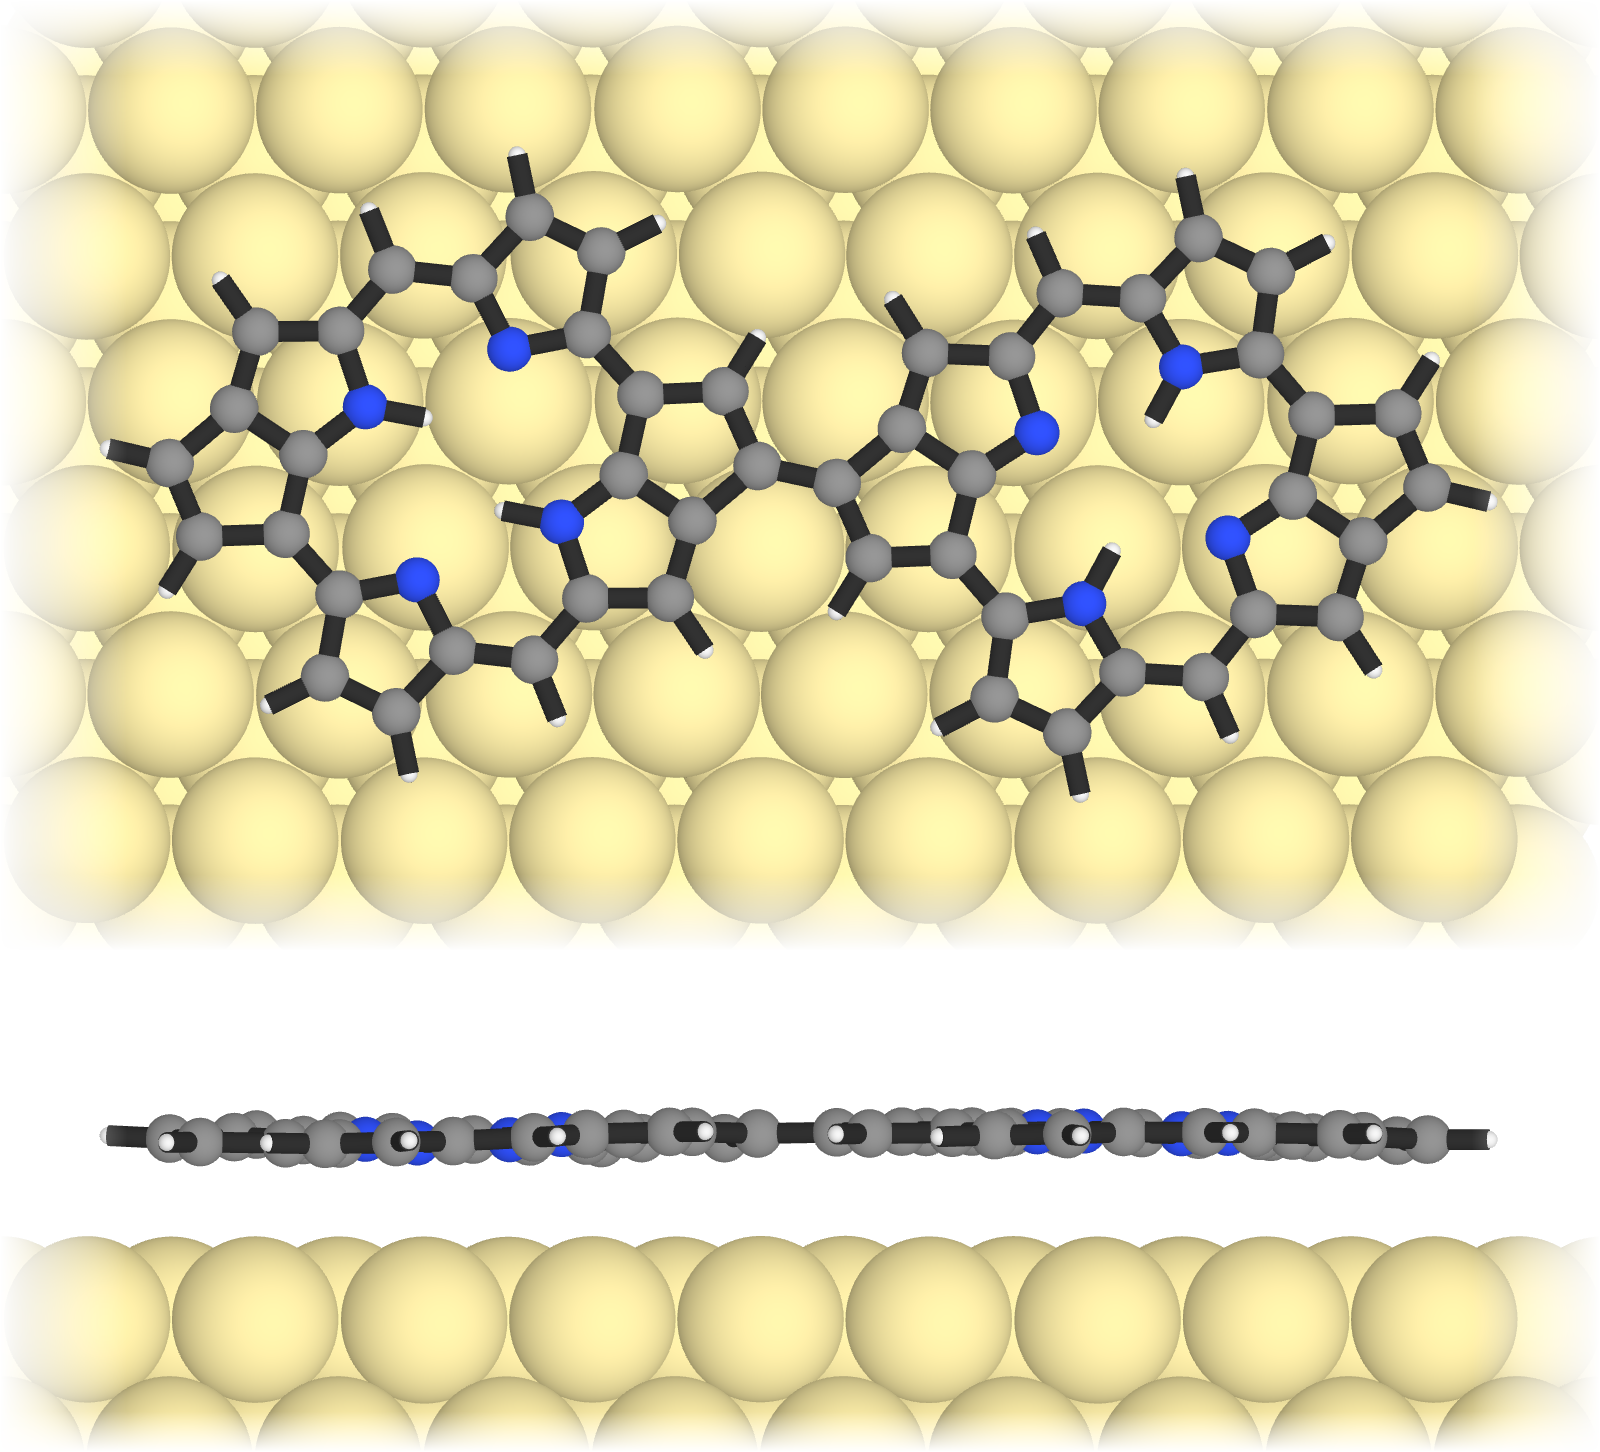
On the left hand side is what you sometimes see in literature, created with the VESTA software. On the right hand side is what I think is a much better illustration, created with Julia and my library ChemfilesViewer.jl.
I will show you how you can create such images with just a few lines of code. And even better, you can streamline this process and create a whole series of images with different molecules and surfaces automatically.
The data
The data that we need is the molecule and the surface - this is what you will usually get from DFT calculations. The molecule can be in any common format, such as .xyz, .sdf, .pdb and so on.
The code
Let’s code step by step. First we include the necessary packages and load the molecule from an xyz file that contains the atomic coodinated that were obtained from theoretical calculations:
using ChemfilesViewer
using Images

mol = load_molecule("dimer.xyz")
If you do not have ChemfilesViewer.jl installed already, you can do so with ] add ChemfilesViewer in the Julia REPL.
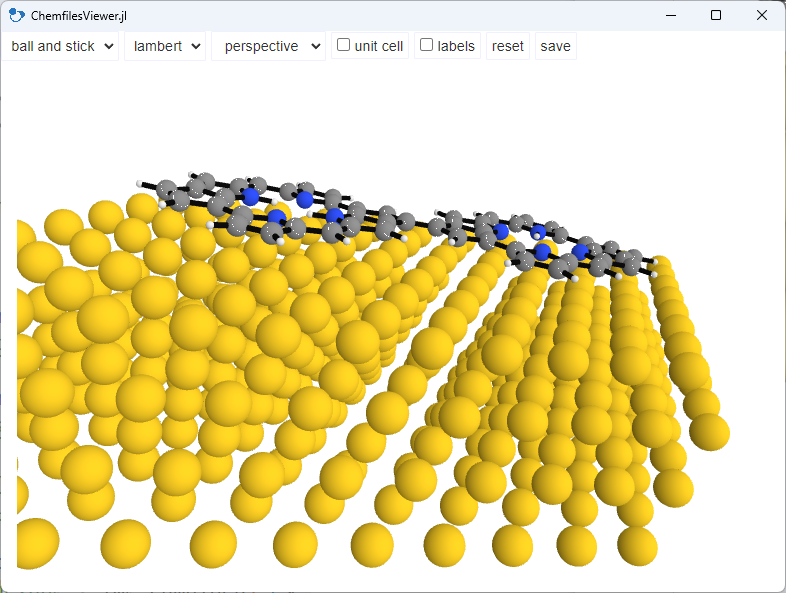
Ok, now we just bring up the visualization:
render_molecule(mol)
It is as easy as that. This will open a window (or visualize inline if you use a Jupyter notebook) and you can rotate the molecule with the mouse. You can also zoom in and out with the mouse wheel.
OK, we want to make it look nicer. So all we have to do is to change some of the parameters. First, we make the surface atoms bigger. Second, we change the colors of the surface atoms and the bonds within the molecule for better contrast. This means that we make the surface atoms brighter and the bonds darker.
In addition, we will change the camare type to orthographic and zoom in a little bit. This will be useful for the side view.
We will also hide the unit cell, because we do not need it here.
And we set the camera position to the top view, i.e. z and save the image to a png file.
set_options!(
    Dict(
        "styles" => Dict(
            "Au" => Dict("color" => "#feefa9", "radius" => 2.4),
            "bond" => Dict("color" => "#303030", "radius" => 0.3)
        ),
        "cameraZoom" => 1.7, "showUnitCell" => false, "cameraType" => "orthographic",
    )
)

set_camera_position!("z")
save_image("dimer_top.png")
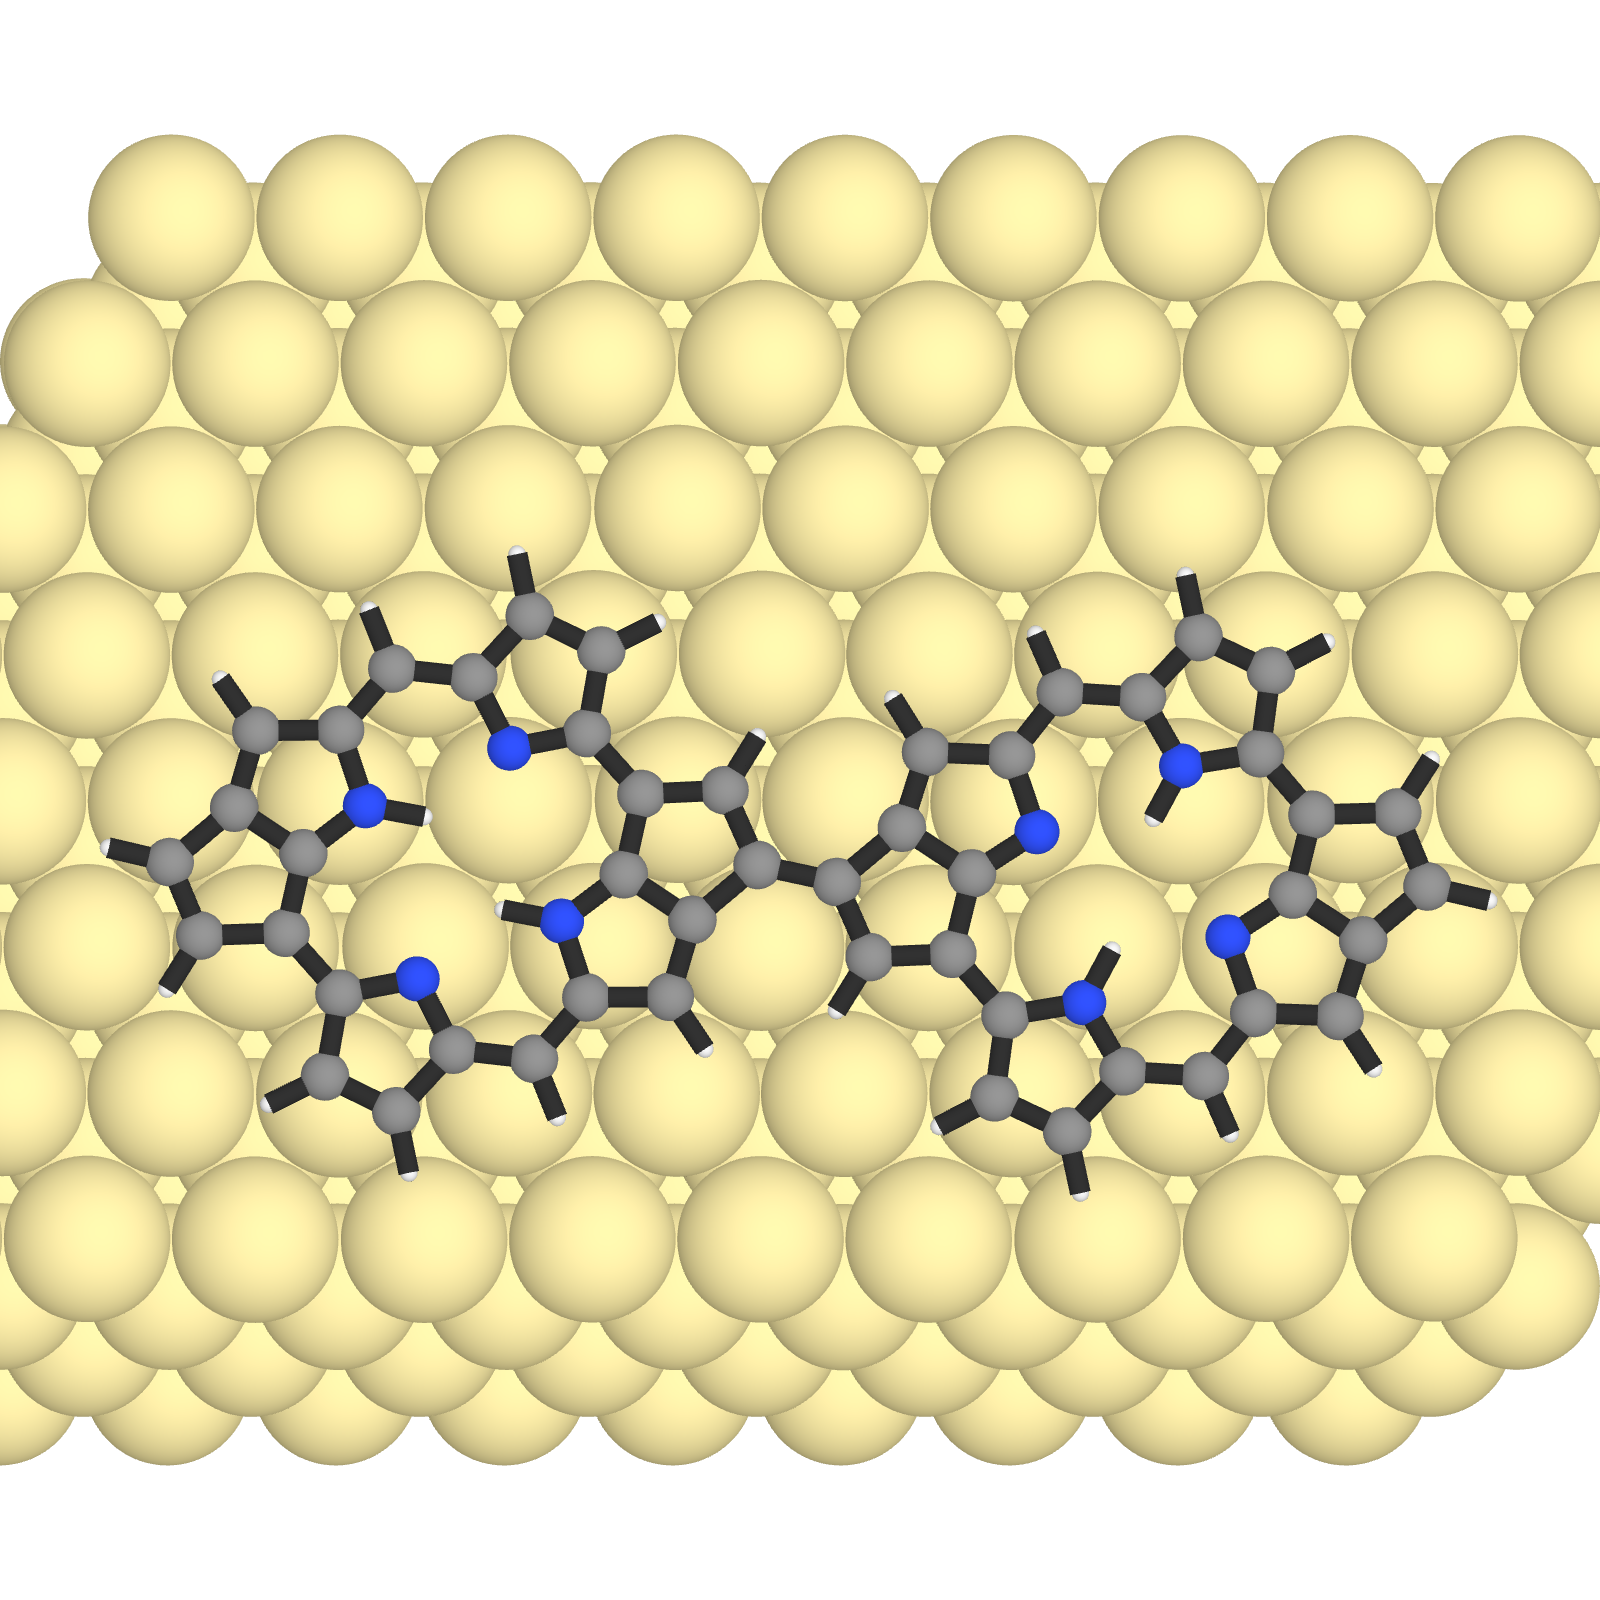
You can already see how much better it is. We can clearly see the molecular structure and the surface atoms are not distracting.
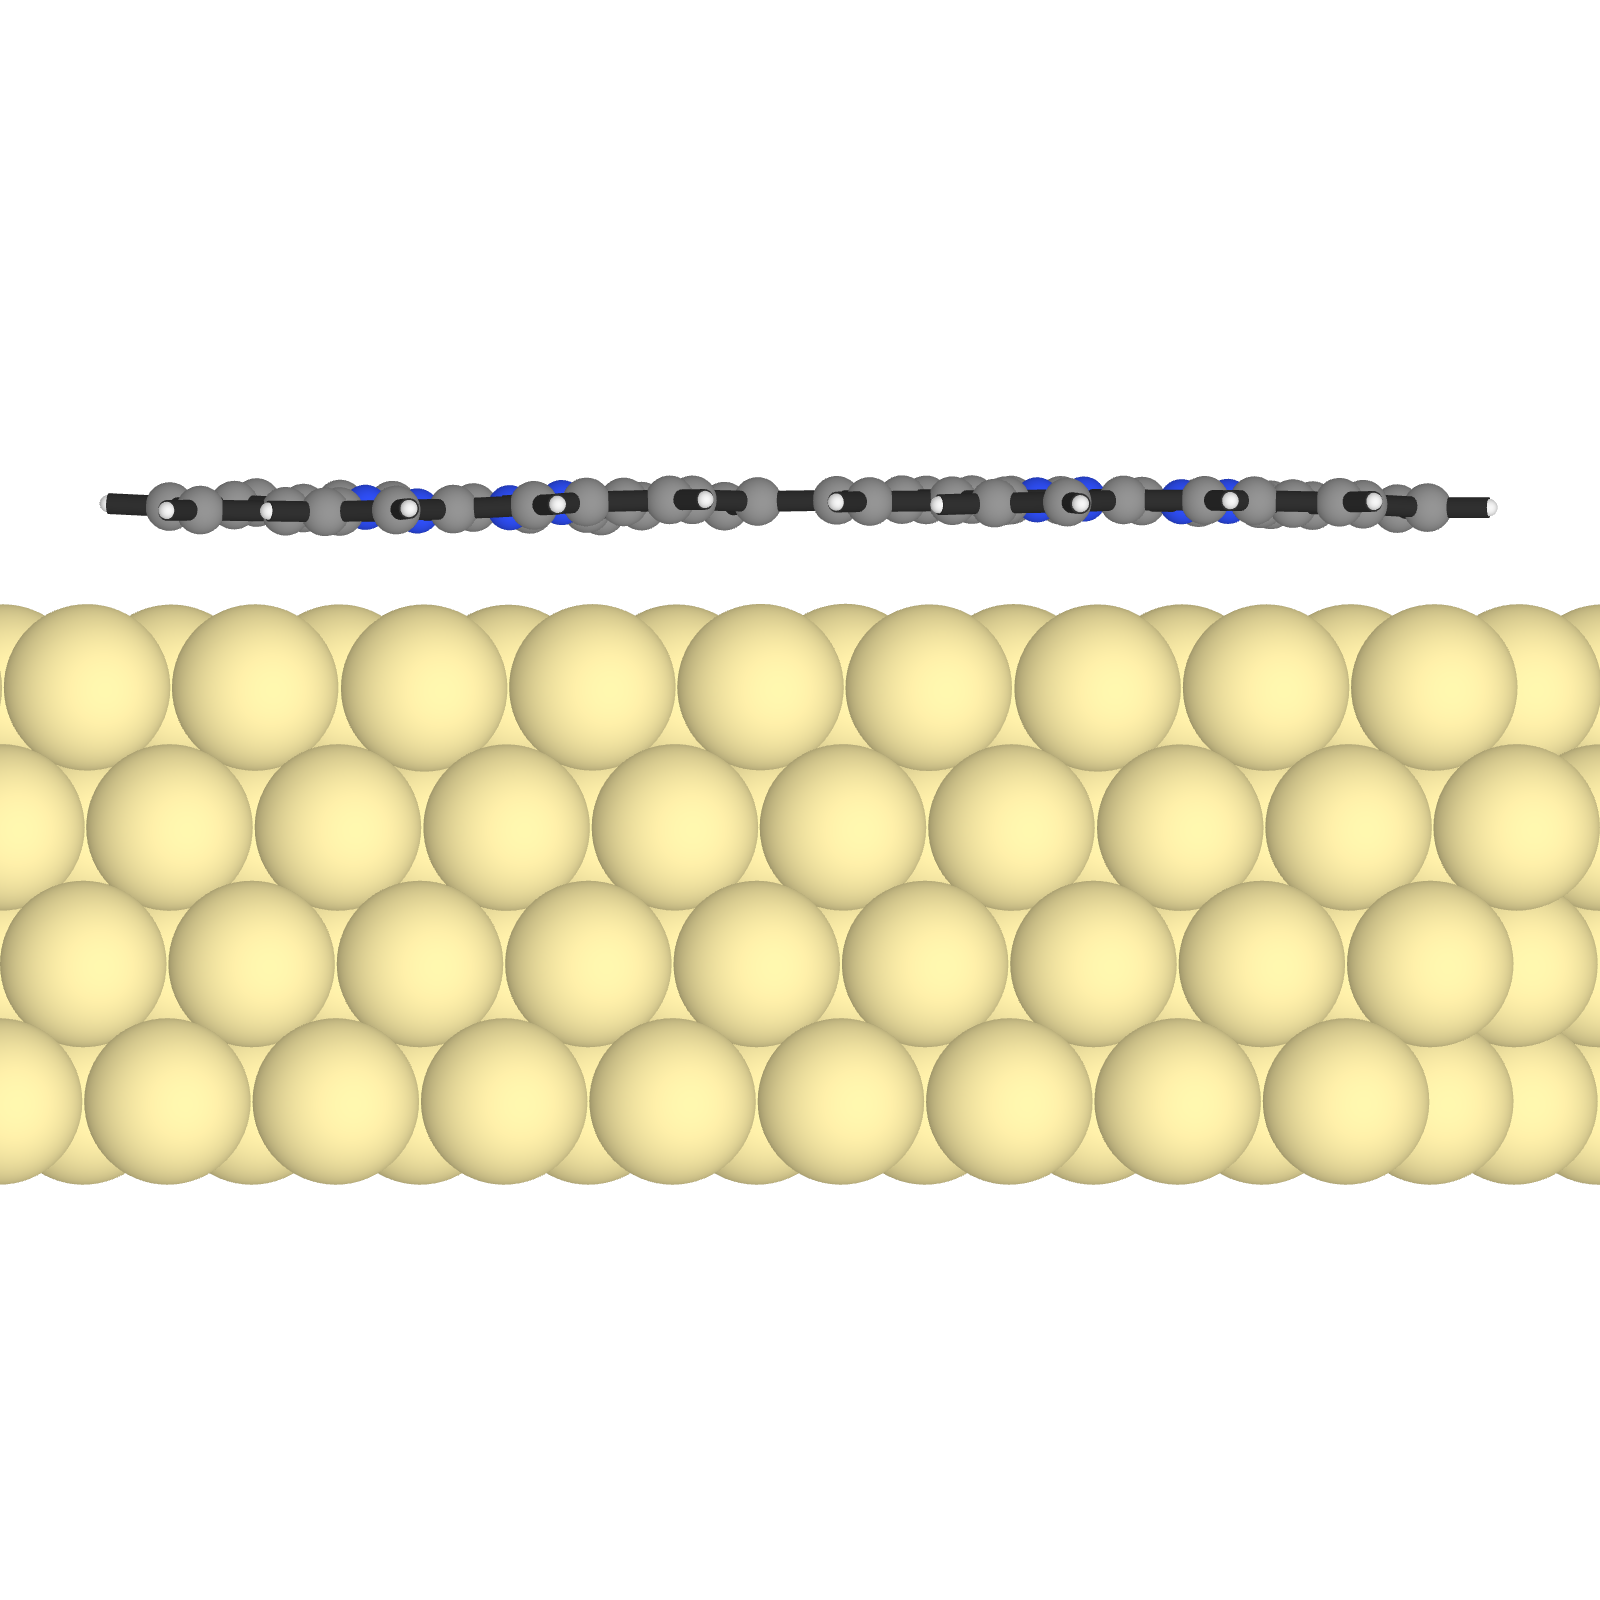
Let’s also create a side view. We just have to change the camera position to y and save the image again. There is a - for the camera position, because we want to look at the molecule from the other side.
set_camera_position!("y", "-")
save_image("dimer_side.png")
The grand finale: combining the images
Great! Now we have two images that we can combine. We also want to crop in a bit. So we load the images and display a subset of the image matrix:
img_top = load("dimer_top.png")[400:1350, 1:1600]
img_side = load("dimer_side.png")[320:820, 1:1600]
And finally we create a nice fadeout effect using the function fadeout_img and we stack the images on top of each other using vcat. As easy as that! All that is left to do is to save it to a png file:
img_combined = vcat(fadeout_img(img_top), fadeout_img(img_side))
save("dimer_top_side.png", img_combined)
It is that easy. You can also create a whole series of images with different molecules and surfaces automatically. I have done this for my our recent paper The role of aromaticity in the cyclization and polymerization of alkyne-substituted porphyrins on Au(111) (published in Nature Chemistry).
Going interactive
Similarly, you can create such images for interactive visualization in the browser. This is very useful for presentations. I have done that in the past for some of my talks at conferences. You can see an example here. You can load different structures, rotate and zoom-in using the mouse. There is also an interactive video there that shows energy dissipation between the molecule and the surface.
You can read about the scientific background in our previous Nature Chemistry paper: Imaging single-molecule reaction intermediates stabilized by surface dissipation and entropy.
Conclusion
It only takes a few lines of code to create nice illustrations of molecules at surfaces. You can also create a whole series of images with different molecules and surfaces automatically. This is a huge time saver!